
Technical analysis is the study of historical price action to forecast future market movement. Before diving into indicators and complex strategies, every trader needs to understand three foundational concepts: support, resistance, and trendlines.
What Is Support?
Support is a price level where buying interest has historically been strong enough to stop a decline and push price back up. It acts like a ‘floor’ beneath the market. The more times price bounces off a level, the more significant that support is considered to be.
What Is Resistance?
Resistance is the opposite of support — a price level where selling interest has historically overwhelmed buying pressure, acting as a ‘ceiling’ that price struggles to break through.
KEY CONCEPT: When resistance is eventually broken, it often becomes a new support level, and vice versa. This is known as ‘role reversal.’
How to Identify Support and Resistance
- Look for price levels where the market has reversed direction multiple times
- Round numbers often act as psychological support/resistance (e.g. 1.1000 on EUR/USD)
- Previous swing highs and lows are common reference points
- Higher timeframes tend to produce more reliable levels than lower timeframes
Understanding Trendlines
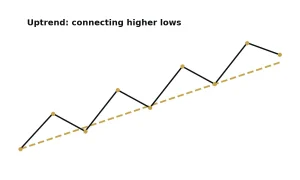
A trendline is a straight line drawn along a series of price highs (downtrend) or lows (uptrend) to visualize the direction and strength of a trend. Trendlines help traders identify whether a market is trending, ranging, or potentially reversing.
Technical analysis is the study of historical price action to forecast future market movement. Before diving into indicators and complex strategies, every trader needs to understand three foundational concepts: support, resistance, and trendlines.
Drawing Valid Trendlines
- An uptrend line connects a series of higher lows
- A downtrend line connects a series of lower highs
- At least two touchpoints are needed to draw a trendline; three or more confirm its validity
- The steeper the trendline, the less sustainable it often is over time
Putting It All Together
Support, resistance, and trendlines form the backbone of technical analysis. Combined with price action and volume, they help traders identify potential entry and exit points, anticipate reversals, and manage risk more effectively. Mastering these basics is essential before layering on more advanced tools like indicators and chart patterns.
Risk Warning: CFDs and forex trading are complex instruments and come with a high risk of losing money rapidly due to leverage. You should consider whether you understand how these products work and whether you can afford to take the high risk of losing your money. Past performance is not indicative of future results. This article is for educational purposes only and does not constitute investment advice.
Leave a Reply