Author: Admin

  • Building a Trading Plan and Journal

    Building a Trading Plan and Journal

    Trading without a plan is one of the most common reasons new traders struggle. A well-defined trading plan, paired with a disciplined journal, provides structure, accountability, and a framework for continuous improvement.

    What Is a Trading Plan?

    A trading plan is a written set of rules that governs your trading decisions, removing guesswork and emotion from the process. It should be specific enough to guide real decisions, but flexible enough to adapt as you gain experience.

    Core Components of a Trading Plan

    • Markets and instruments you will trade
    • Trading style (swing, day trading, scalping) and timeframes used
    • Entry criteria — the specific conditions that trigger a trade
    • Exit criteria — stop-loss and take-profit rules
    • Position sizing and maximum risk per trade
    • Maximum daily/weekly loss limits
    • Rules for when NOT to trade (e.g. during major news, low liquidity)

    Why a Trading Journal Matters

    A trading journal is a record of every trade you take, including the reasoning behind it and the outcome. Over time, it becomes one of the most valuable tools for identifying patterns in your decision-making — both good and bad.

    What to Record in Your Journal

    • Entry and exit price, date, and instrument
    • Reason for entering the trade (technical, fundamental, or both)
    • Position size and risk taken
    • Outcome and resulting profit/loss
    • Emotional state and any deviations from your plan

    KEY TAKEAWAY: Reviewing your journal weekly or monthly helps identify recurring mistakes before they become expensive habits.

    Turning Data Into Improvement

    The real value of a trading journal comes from regular review. Look for patterns: Are certain setups more profitable than others? Do you perform worse at certain times of day? Are losses concentrated around deviations from your plan? Use these insights to refine your trading plan over time.

    Also Read: Using Indicators: RSI, MACD, Moving Averages, and Bollinger Bands

    Risk Warning: CFDs and forex trading are complex instruments and come with a high risk of losing money rapidly due to leverage. You should consider whether you understand how these products work and whether you can afford to take the high risk of losing your money. Past performance is not indicative of future results. This article is for educational purposes only and does not constitute investment advice.
  • Using Indicators: RSI, MACD, Moving Averages, and Bollinger Bands

    Using Indicators: RSI, MACD, Moving Averages, and Bollinger Bands

    Technical indicators translate raw price data into visual signals that help traders identify trends, momentum, and potential reversal points. Here’s an overview of four of the most widely used indicators.

    Moving Averages (MA)

    A moving average smooths out price data over a specified period, helping traders identify the underlying trend direction. The Simple Moving Average (SMA) weighs all periods equally, while the Exponential Moving Average (EMA) gives more weight to recent price action.

    • Price above a rising moving average often signals an uptrend
    • Price below a falling moving average often signals a downtrend
    • Crossovers between short-term and long-term moving averages can signal trend changes

    Relative Strength Index (RSI)

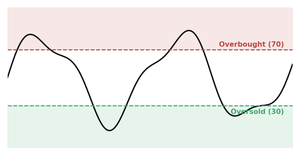
    RSI is a momentum oscillator measured on a scale of 0-100, used to identify overbought or oversold conditions. Readings above 70 are typically considered overbought, while readings below 30 are considered oversold.

    MACD (Moving Average Convergence Divergence)

    MACD shows the relationship between two moving averages of price, helping identify momentum shifts and potential trend changes. A MACD crossover — when the MACD line crosses the signal line — is often used as a trade signal.

    Bollinger Bands

    Bollinger Bands consist of a moving average with two bands plotted above and below based on standard deviation. They expand during periods of high volatility and contract during periods of low volatility, helping traders visualize relative price extremes.

    KEY TAKEAWAY: No single indicator should be used in isolation. Combining trend, momentum, and volatility indicators provides a more complete market picture.

    Avoiding Indicator Overload

    It’s tempting to add many indicators to a chart, but this can lead to conflicting signals and analysis paralysis. Most experienced traders rely on a small, complementary set of indicators rather than overcrowding their charts.

    Read More: Understanding Volatility and How to Trade It

    Risk Warning: CFDs and forex trading are complex instruments and come with a high risk of losing money rapidly due to leverage. You should consider whether you understand how these products work and whether you can afford to take the high risk of losing your money. Past performance is not indicative of future results. This article is for educational purposes only and does not constitute investment advice.
  • Understanding Volatility and How to Trade It

    Understanding Volatility and How to Trade It

    Volatility refers to the degree and speed of price fluctuation in a market over a given period. It’s a double-edged sword: higher volatility creates larger profit opportunities, but also larger risk. Understanding how to navigate it is a core trading skill.

    What Causes Volatility?

    • Major economic data releases (interest rate decisions, employment reports)
    • Geopolitical events and unexpected news
    • Low liquidity periods, such as holidays or overnight sessions
    • Central bank announcements and policy shifts
    • Earnings reports for share CFDs

    Measuring Volatility

    Traders often use tools like Average True Range (ATR) or Bollinger Bands to quantify volatility. ATR measures the average price range over a set period, helping traders set realistic stop-loss and take-profit distances relative to current market conditions.

    High Volatility vs. Low Volatility Environments

    • High volatility — larger price swings, wider spreads, greater profit potential and risk
    • Low volatility — smaller price swings, tighter ranges, often associated with consolidation

    RISK NOTE: Spreads often widen significantly during high-volatility events like major news releases — factor this into your risk planning.

    Strategies for Trading Volatile Markets

    • Widen stop-loss levels to account for larger price swings, while adjusting position size accordingly
    • Reduce position size to keep dollar risk consistent during volatile periods
    • Be cautious trading directly into major news releases without a clear plan
    • Consider avoiding new positions immediately before high-impact economic events

    Volatility Isn’t Inherently Good or Bad

    Volatility simply reflects the pace of price discovery. The key is adjusting your strategy, position sizing, and expectations to match current market conditions rather than applying a one-size-fits-all approach.

    Also Read: Swing Trading vs. Day Trading vs. Scalping

    Risk Warning: CFDs and forex trading are complex instruments and come with a high risk of losing money rapidly due to leverage. You should consider whether you understand how these products work and whether you can afford to take the high risk of losing your money. Past performance is not indicative of future results. This article is for educational purposes only and does not constitute investment advice.
  • Swing Trading vs. Day Trading vs. Scalping

    Swing Trading vs. Day Trading vs. Scalping

    One of the most important decisions a trader makes isn’t which asset to trade, but which trading style suits their personality, schedule, and risk tolerance. The three most common styles are swing trading, day trading, and scalping.

    Swing Trading

    Swing traders hold positions for several days to weeks, aiming to capture medium-term price swings. This style requires less screen time than day trading and relies more heavily on both technical and fundamental analysis.

    • Time commitment: Low to moderate — a few hours per day or less
    • Typical holding period: Days to weeks
    • Best suited for: Traders with full-time jobs or limited screen time

    Day Trading

    Day traders open and close positions within the same trading day, avoiding overnight exposure. This style demands active market monitoring and quick decision-making throughout the trading session.

    • Time commitment: High — several hours during market sessions
    • Typical holding period: Minutes to hours (closed by end of day)
    • Best suited for: Traders who can dedicate significant daily time to markets

    Scalping

    Scalpers aim to profit from very small price movements, often entering and exiting dozens of trades within minutes or even seconds. This style requires intense focus, fast execution, and low trading costs.

    • Time commitment: Very high — constant market attention during sessions
    • Typical holding period: Seconds to minutes
    • Best suited for: Highly disciplined traders comfortable with rapid decision-making

    KEY TAKEAWAY: There is no ‘best’ style — only the style best suited to your personality, schedule, and risk tolerance.

    Choosing Your Style

    Consider how much time you can realistically dedicate to trading, how you handle stress and quick decisions, and your personal risk tolerance. Many traders experiment with multiple styles before settling into the one that fits best.

    Also Read: Correlation Between Currency Pairs and Commodities

    Risk Warning: CFDs and forex trading are complex instruments and come with a high risk of losing money rapidly due to leverage. You should consider whether you understand how these products work and whether you can afford to take the high risk of losing your money. Past performance is not indicative of future results. This article is for educational purposes only and does not constitute investment advice.

  • Correlation Between Currency Pairs and Commodities

    Correlation Between Currency Pairs and Commodities

    Markets don’t move in isolation. Many currency pairs and commodities share strong historical correlations, driven by trade relationships, economic structure, and investor behavior. Understanding these relationships can improve both analysis and risk management.

    What Is Correlation?

    Correlation measures how two assets move in relation to one another, expressed on a scale from -1 to +1. A correlation near +1 means assets tend to move in the same direction; near -1 means they tend to move in opposite directions; near 0 means little to no relationship.

    Commodity-Linked Currencies

    • AUD (Australian Dollar) — closely tied to gold and iron ore exports
    • CAD (Canadian Dollar) — closely tied to crude oil exports
    • NZD (New Zealand Dollar) — linked to dairy and agricultural exports

    EXAMPLE: USD/CAD often shows an inverse relationship with oil prices — as oil rises, CAD tends to strengthen, pushing USD/CAD lower.

    Gold and the US Dollar

    Gold is priced in US Dollars globally and has historically shown an inverse correlation with the currency. When the Dollar weakens, gold often becomes cheaper for holders of other currencies, increasing demand and pushing prices higher — and vice versa.

    Why Correlation Matters for Traders

    • Avoid unintentionally doubling exposure by trading multiple correlated instruments in the same direction
    • Use correlated assets to confirm or question a trading thesis
    • Identify hedging opportunities using negatively correlated instruments
    • Understand that correlations can shift over time and are not fixed

    A Word of Caution

    Correlations are historical tendencies, not guarantees. They can weaken, strengthen, or temporarily break down due to unique market events. Always treat correlation as one input among many in your broader analysis.

    Also Read: Risk Management Strategies: Stop-Loss, Take-Profit, and Position Sizing

    Risk Warning: CFDs and forex trading are complex instruments and come with a high risk of losing money rapidly due to leverage. You should consider whether you understand how these products work and whether you can afford to take the high risk of losing your money. Past performance is not indicative of future results. This article is for educational purposes only and does not constitute investment advice.
  • Risk Management Strategies: Stop-Loss, Take-Profit, and Position Sizing

    Risk Management Strategies: Stop-Loss, Take-Profit, and Position Sizing

    No trading strategy is complete without a solid risk management framework. Even the best analysis can’t guarantee a winning trade — what separates consistently successful traders is how they manage risk when they’re wrong.

    Stop-Loss Orders

    A stop-loss is a predetermined price level at which a losing position is automatically closed, limiting further loss. Setting a stop-loss before entering a trade removes emotional decision-making from the exit process.

    • Place stops based on technical structure (below support, above resistance), not arbitrary dollar amounts
    • Avoid placing stops too tight, which can result in premature exits from normal volatility
    • Never move a stop-loss further away once a trade is losing

    Take-Profit Orders

    A take-profit order automatically closes a position once it reaches a predefined profit target, locking in gains without requiring you to monitor the market constantly.

    Position Sizing

    Position sizing determines how much capital to risk on a single trade. A common guideline is to risk no more than 1-2% of total account equity on any single position.

    EXAMPLE: Risking 1% per trade means a string of 10 consecutive losses would only reduce your account by roughly 10%, not wipe it out.

    The Risk-Reward Ratio

    The risk-reward ratio compares the potential loss of a trade to its potential gain. A 1:2 risk-reward ratio means you’re risking $1 to potentially make $2. Favorable risk-reward ratios allow traders to remain profitable even with a win rate below 50%.

    Building a Complete Risk Framework

    • Define maximum risk per trade and per day
    • Use stop-loss and take-profit orders consistently
    • Diversify exposure across uncorrelated instruments where possible
    • Review and adjust risk parameters as account size changes
    • Keep a trading journal to evaluate risk decisions over time

    Read More: Fundamental Analysis: How Economic Data Moves Markets

    Risk Warning: CFDs and forex trading are complex instruments and come with a high risk of losing money rapidly due to leverage. You should consider whether you understand how these products work and whether you can afford to take the high risk of losing your money. Past performance is not indicative of future results. This article is for educational purposes only and does not constitute investment advice.
  • Fundamental Analysis: How Economic Data Moves Markets

    Fundamental Analysis: How Economic Data Moves Markets

    While technical analysis studies price charts, fundamental analysis looks at the underlying economic, financial, and political factors that drive an asset’s value. For forex and CFD traders, understanding fundamentals is essential to anticipating major market moves.

    Key Economic Indicators to Watch

    Interest Rates

    Central bank interest rate decisions are among the most significant drivers of currency value. Higher interest rates tend to attract foreign capital, strengthening a currency, while rate cuts often have the opposite effect.

    Inflation (CPI)

    The Consumer Price Index measures the rate of price increases across an economy. Persistently high inflation often prompts central banks to raise interest rates, directly influencing currency strength.

    Employment Data

    Reports like the US Non-Farm Payrolls (NFP) offer insight into economic health. Strong employment figures generally support a currency, while weak figures can weigh on it.

    GDP (Gross Domestic Product)

    GDP measures the total economic output of a country. Strong GDP growth is typically positive for a currency, signaling a healthy, expanding economy.

    KEY CONCEPT: Markets react not just to the data itself, but to how it compares against analyst expectations.

    Other Fundamental Drivers

    • Central bank commentary and forward guidance
    • Political stability and elections
    • Trade balances and tariffs
    • Geopolitical events and risk sentiment
    • Commodity prices, particularly for commodity-linked currencies

    Combining Fundamentals with Technicals

    Many experienced traders use fundamental analysis to determine market bias or direction, and technical analysis to time entries and exits. Following an economic calendar is essential for anticipating volatility around major data releases.

    Also Read: Introduction to Candlestick Patterns

    Risk Warning: CFDs and forex trading are complex instruments and come with a high risk of losing money rapidly due to leverage. You should consider whether you understand how these products work and whether you can afford to take the high risk of losing your money. Past performance is not indicative of future results. This article is for educational purposes only and does not constitute investment advice.
  • Introduction to Candlestick Patterns

    Introduction to Candlestick Patterns

    Candlestick charts are the most widely used chart type in trading, offering a visual representation of price action that reveals not just where price moved, but the psychology behind the move. Understanding key candlestick patterns can help traders spot potential reversals and continuations.

    Anatomy of a Candlestick

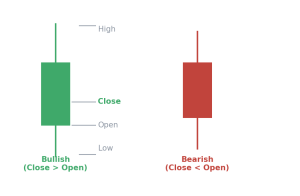
    Each candlestick shows four data points for a given period: the open, high, low, and close. The ‘body’ represents the range between open and close, while the ‘wicks’ (or shadows) show the high and low extremes.

    Single-Candle Patterns

    • Doji — open and close are nearly equal, signaling indecision
    • Hammer — a small body with a long lower wick, often signaling a bullish reversal after a downtrend
    • Shooting Star — a small body with a long upper wick, often signaling a bearish reversal after an uptrend.
    • Marubozu — a candle with little to no wick, indicating strong directional conviction

    Multi-Candle Patterns

    • Bullish/Bearish Engulfing — a candle whose body fully ‘engulfs’ the previous candle’s body, signaling a potential reversal
    • Morning Star — a three-candle bullish reversal pattern appearing after a downtrend
    • Evening Star — a three-candle bearish reversal pattern appearing after an uptrend
    • Three White Soldiers / Three Black Crows — three consecutive strong candles signaling trend continuation or reversal

    KEY TAKEAWAY: Candlestick patterns are most reliable when they appear at key support/resistance levels and are confirmed by subsequent price action.

    Using Candlesticks in Your Trading

    Candlestick patterns should rarely be used in isolation. Combining them with trend analysis, support/resistance, and volume gives a more complete picture and helps filter out false signals.

    Read More: Popular Chart Patterns and What They Signal

    Risk Warning: CFDs and forex trading are complex instruments and come with a high risk of losing money rapidly due to leverage. You should consider whether you understand how these products work and whether you can afford to take the high risk of losing your money. Past performance is not indicative of future results. This article is for educational purposes only and does not constitute investment advice.
  • Popular Chart Patterns and What They Signal

    Popular Chart Patterns and What They Signal

    Chart patterns are recognizable formations created by price movements on a chart. Traders use them to anticipate potential continuations or reversals in trend. While no pattern guarantees an outcome, understanding what each formation typically signals is a valuable analytical skill.

    Reversal Patterns

    Head and Shoulders

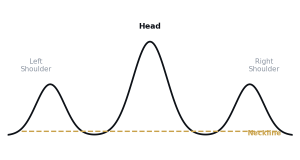
    This pattern consists of three peaks — a higher central peak (head) flanked by two lower peaks (shoulders). It typically signals a reversal from an uptrend to a downtrend. The inverse version signals a reversal from a downtrend to an uptrend.

    Double Top and Double Bottom

    A double top forms when price reaches a similar high twice, unable to break through, signaling a potential bearish reversal. A double bottom is the mirror image, signaling a potential bullish reversal.

    Continuation Patterns

    Flags and Pennants

    These short-term consolidation patterns typically appear after a strong price move and suggest the prior trend is likely to continue once the pattern completes.

    Triangles

    • Ascending triangle — flat resistance with rising support, often bullish
    • Descending triangle — flat support with falling resistance, often bearish
    • Symmetrical triangle — converging support and resistance, direction depends on breakout

    RISK NOTE: Chart patterns are probabilistic tools, not guarantees. Always confirm with volume and other indicators before acting.

    Trading Chart Patterns Responsibly

    • Wait for confirmed breakouts rather than anticipating them
    • Use volume to validate the strength of a breakout
    • Set stop-losses beyond the pattern’s structure
    • Combine patterns with broader trend and market context

    Read More: Technical Analysis Basics: Support, Resistance, and Trendlines

    Risk Warning: CFDs and forex trading are complex instruments and come with a high risk of losing money rapidly due to leverage. You should consider whether you understand how these products work and whether you can afford to take the high risk of losing your money. Past performance is not indicative of future results. This article is for educational purposes only and does not constitute investment advice.
  • Technical Analysis Basics: Support, Resistance, and Trendlines

    Technical Analysis Basics: Support, Resistance, and Trendlines

    Technical analysis is the study of historical price action to forecast future market movement. Before diving into indicators and complex strategies, every trader needs to understand three foundational concepts: support, resistance, and trendlines.

    What Is Support?

    Support is a price level where buying interest has historically been strong enough to stop a decline and push price back up. It acts like a ‘floor’ beneath the market. The more times price bounces off a level, the more significant that support is considered to be.

    What Is Resistance?

    Resistance is the opposite of support — a price level where selling interest has historically overwhelmed buying pressure, acting as a ‘ceiling’ that price struggles to break through.

    KEY CONCEPT: When resistance is eventually broken, it often becomes a new support level, and vice versa. This is known as ‘role reversal.’

    How to Identify Support and Resistance

    • Look for price levels where the market has reversed direction multiple times
    • Round numbers often act as psychological support/resistance (e.g. 1.1000 on EUR/USD)
    • Previous swing highs and lows are common reference points
    • Higher timeframes tend to produce more reliable levels than lower timeframes

    Understanding Trendlines

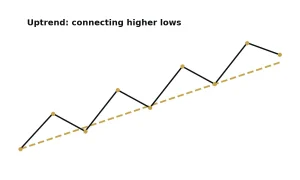
    A trendline is a straight line drawn along a series of price highs (downtrend) or lows (uptrend) to visualize the direction and strength of a trend. Trendlines help traders identify whether a market is trending, ranging, or potentially reversing.

    Technical analysis is the study of historical price action to forecast future market movement. Before diving into indicators and complex strategies, every trader needs to understand three foundational concepts: support, resistance, and trendlines.

    Drawing Valid Trendlines

    • An uptrend line connects a series of higher lows
    • A downtrend line connects a series of lower highs
    • At least two touchpoints are needed to draw a trendline; three or more confirm its validity
    • The steeper the trendline, the less sustainable it often is over time

    Putting It All Together

    Support, resistance, and trendlines form the backbone of technical analysis. Combined with price action and volume, they help traders identify potential entry and exit points, anticipate reversals, and manage risk more effectively. Mastering these basics is essential before layering on more advanced tools like indicators and chart patterns.

    Risk Warning: CFDs and forex trading are complex instruments and come with a high risk of losing money rapidly due to leverage. You should consider whether you understand how these products work and whether you can afford to take the high risk of losing your money. Past performance is not indicative of future results. This article is for educational purposes only and does not constitute investment advice.