Tag: Trading Chart Patterns

  • Introduction to Candlestick Patterns

    Introduction to Candlestick Patterns

    Candlestick charts are the most widely used chart type in trading, offering a visual representation of price action that reveals not just where price moved, but the psychology behind the move. Understanding key candlestick patterns can help traders spot potential reversals and continuations.

    Anatomy of a Candlestick

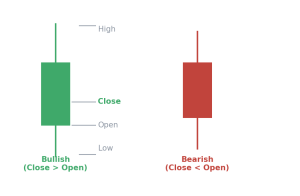
    Each candlestick shows four data points for a given period: the open, high, low, and close. The ‘body’ represents the range between open and close, while the ‘wicks’ (or shadows) show the high and low extremes.
    Single-Candle Patterns

    • Doji — open and close are nearly equal, signaling indecision
    • Hammer — a small body with a long lower wick, often signaling a bullish reversal after a downtrend
    • Shooting Star — a small body with a long upper wick, often signaling a bearish reversal after an uptrend.
    • Marubozu — a candle with little to no wick, indicating strong directional conviction

    Multi-Candle Patterns

    • Bullish/Bearish Engulfing — a candle whose body fully ‘engulfs’ the previous candle’s body, signaling a potential reversal
    • Morning Star — a three-candle bullish reversal pattern appearing after a downtrend
    • Evening Star — a three-candle bearish reversal pattern appearing after an uptrend
    • Three White Soldiers / Three Black Crows — three consecutive strong candles signaling trend continuation or reversal

    KEY TAKEAWAY: Candlestick patterns are most reliable when they appear at key support/resistance levels and are confirmed by subsequent price action.

    Using Candlesticks in Your Trading

    Candlestick patterns should rarely be used in isolation. Combining them with trend analysis, support/resistance, and volume gives a more complete picture and helps filter out false signals.

    Read More: Popular Chart Patterns and What They Signal

    Risk Warning: CFDs and forex trading are complex instruments and come with a high risk of losing money rapidly due to leverage. You should consider whether you understand how these products work and whether you can afford to take the high risk of losing your money. Past performance is not indicative of future results. This article is for educational purposes only and does not constitute investment advice.
  • Popular Chart Patterns and What They Signal

    Popular Chart Patterns and What They Signal

    Chart patterns are recognizable formations created by price movements on a chart. Traders use them to anticipate potential continuations or reversals in trend. While no pattern guarantees an outcome, understanding what each formation typically signals is a valuable analytical skill.

    Reversal Patterns

    Head and Shoulders

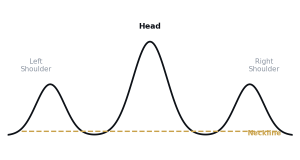
    This pattern consists of three peaks — a higher central peak (head) flanked by two lower peaks (shoulders). It typically signals a reversal from an uptrend to a downtrend. The inverse version signals a reversal from a downtrend to an uptrend.

    Double Top and Double Bottom

    A double top forms when price reaches a similar high twice, unable to break through, signaling a potential bearish reversal. A double bottom is the mirror image, signaling a potential bullish reversal.

    Continuation Patterns

    Flags and Pennants

    These short-term consolidation patterns typically appear after a strong price move and suggest the prior trend is likely to continue once the pattern completes.

    Triangles

    • Ascending triangle — flat resistance with rising support, often bullish
    • Descending triangle — flat support with falling resistance, often bearish
    • Symmetrical triangle — converging support and resistance, direction depends on breakout

    RISK NOTE: Chart patterns are probabilistic tools, not guarantees. Always confirm with volume and other indicators before acting.

    Trading Chart Patterns Responsibly

    • Wait for confirmed breakouts rather than anticipating them
    • Use volume to validate the strength of a breakout
    • Set stop-losses beyond the pattern’s structure
    • Combine patterns with broader trend and market context

    Read More: Technical Analysis Basics: Support, Resistance, and Trendlines

    Risk Warning: CFDs and forex trading are complex instruments and come with a high risk of losing money rapidly due to leverage. You should consider whether you understand how these products work and whether you can afford to take the high risk of losing your money. Past performance is not indicative of future results. This article is for educational purposes only and does not constitute investment advice.