Technical indicators translate raw price data into visual signals that help traders identify trends, momentum, and potential reversal points. Here’s an overview of four of the most widely used indicators.
Moving Averages (MA)
A moving average smooths out price data over a specified period, helping traders identify the underlying trend direction. The Simple Moving Average (SMA) weighs all periods equally, while the Exponential Moving Average (EMA) gives more weight to recent price action.
- Price above a rising moving average often signals an uptrend
- Price below a falling moving average often signals a downtrend
- Crossovers between short-term and long-term moving averages can signal trend changes
Relative Strength Index (RSI)
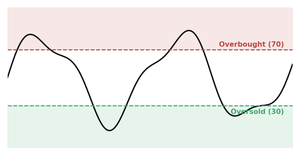
RSI is a momentum oscillator measured on a scale of 0-100, used to identify overbought or oversold conditions. Readings above 70 are typically considered overbought, while readings below 30 are considered oversold.
MACD (Moving Average Convergence Divergence)
MACD shows the relationship between two moving averages of price, helping identify momentum shifts and potential trend changes. A MACD crossover — when the MACD line crosses the signal line — is often used as a trade signal.
Bollinger Bands
Bollinger Bands consist of a moving average with two bands plotted above and below based on standard deviation. They expand during periods of high volatility and contract during periods of low volatility, helping traders visualize relative price extremes.
KEY TAKEAWAY: No single indicator should be used in isolation. Combining trend, momentum, and volatility indicators provides a more complete market picture.
Avoiding Indicator Overload
It’s tempting to add many indicators to a chart, but this can lead to conflicting signals and analysis paralysis. Most experienced traders rely on a small, complementary set of indicators rather than overcrowding their charts.
Read More: Understanding Volatility and How to Trade It
Risk Warning: CFDs and forex trading are complex instruments and come with a high risk of losing money rapidly due to leverage. You should consider whether you understand how these products work and whether you can afford to take the high risk of losing your money. Past performance is not indicative of future results. This article is for educational purposes only and does not constitute investment advice.